By now, most of us have seen the statistics. If you haven’t, CMI reported in their 2015 Benchmarks, Budgets, and Trends that only 21% of marketers feel successful in reporting the ROI of their efforts. The bottom line? Marketers are still struggling to measure their efforts in a meaningful way. While various marketing analytics platforms offer a variety of solutions to the intelligence challenge, part of the problem arises from having to cobble together several different tools to get actionable data. As a result, marketing teams are either drowning in data, or are still struggling to get enough of the right data to show bottom line results.
Analytics Overload
Marketers and marketing teams need a variety of things from their analytics providers. Up until now, one solution has been using multiple analytics platforms to give each individual on a marketing team the data they need. While individuals can be served by this solution, there are accuracy, workflow, and cost issues associated with using lots of platforms. Here are a few:
- You can’t really be sure everyone is measuring data the same way leading to inconsistent reporting
- You have to rely on others to report their data accurately and on time
- It causes data deluge – data coming from multiple directions is hard to aggregate and learn from at the strategic level
- It typically increases cost and strain on already stretched marketing resources
As brands struggle to improve workflow, some have adopted one giant analytics platform and have found themselves sifting through tons of data they don’t actually need. Marketers are frustrated, and they should be. Why should a social media marketer wade through email or search data for information? Why should an executive view days of granular data to get an overall idea of marketing performance?
In the end, marketers need to be able to do two things
- Aggregate data across multiple facets of the marketing department to understand how campaigns, actions, and efforts affect overall findability, conversions, and revenue.
- Drill down to get details about what’s working and what’s not.
And they need to do both of those things in one place to create a strategic team.

The Problem of Consistency
One of the greatest problems of using multiple analytics platforms, is the issue of consistency. Everyone can be measuring the same thing and getting different data if certain conditions are not the same:
- Date range settings
- Data segmentations
- Data filters
- Data collection methods
It’s the little things that can make a big difference, like date range settings. If you’re comparing the same data and getting different numbers, it could be that your date ranges are different. For instance, if you’re looking at data from “last week” when is that, exactly? Does the week start on Sunday, or Monday? Does Sunday start at midnight GMT or midnight local time? This may seem like splitting hairs, but when we’re talking about this at scale and over time, it really does start to matter. Losing a few hours can mean inaccurate conversion metrics, and disparate total counts.
Another issue arising from using multiple analytics platforms is data segmentation differences. For example, the parameters of a marketing campaign and its targeting in an adversting buy on AdWords may be different than the advertising buy on Facebook ads. And it may be different still for SEO monitoring or for content marketing issues. Accurately collecting and reporting your progress depends on how clearly you definie your topics and keywords, your content, and your audience. When those segments aren’t defined in the same way, the data will always be different.
Every platform has their own filters, or they don’t have filters. In either case, when these filters are applied before data extraction, the data they collect will be different depending on the presence or absence of filters, or the differences in the filters, and you won’t be comparing apples to apples anymore. For example, if you’re trying to use Google Analytics, Marketo, Salesforce, and Sprout Social, you will get overlapping reports, but everyone’s data will look a little different. Filtering options like landing pages, campaign groupings, and other options may change the totals in one dashboard, but then can’t be applied to another. How do you make conclusions or inform decisions when you’re looking at groups of data which don’t match? It’s a challenge, to be sure.
The way that data is collected impacts the data you see and not all data is collected in exactly the same way. Your platforms may be relying on other platforms for information. Consider how many tools might be feeding into a single source. What’s the quality of the data being collected? Does the platform actually require code being placed on pages of your site or different integrations? All of these variables make working through tons of platforms even more complicated.
The Data is Out There Somewhere
Finally, if your team members are all using different platforms, you have to rely on other folks to really present their data correctly and to make sure that they’re reporting on time. This presents several challenges. First of all, people are rarely transparent when reporting. In an effort to justify their efforts, individuals may choose to showcase numbers or their KPIs and current wins instead of releasing all data and metrics that you would need to get real insight into what is working and is not working.
Secondly, not all teams and roles have the same objectives. Some people are trying to measure things like general awareness. Other people are trying to track sales to close. Everybody has a different goal they’re attempting to accomplish. Different goals and perspectives by data reporters often means that data is reported in different ways.
Finally, no matter how stable your team is, team members leave. When team members leave, the data for the platform they have been using may drop off for a while. When a team member is replaced, the next person to fill that position may not want to report the same way, using the same platform. What seems urgent to you, may not be urgent to someone else and some people are just slow or are focused on other things. Whatever the reason, the result is that you don’t have the metrics you need when you need them. If everyone on the team is using the same platform, you can just get the information for yourself when you need it.
Drowning in Data
Data deluge happens when you have data coming in from all different directions. That means lots of information and little insight. What marketers need are actionable next steps and a high-level view to understand what’s happening across marketing. They need to aggregate the effect of individual marketing actions on conversions and revenue. They also need the ability to dive down into data and see things at a granular level to understand content, search, social, and marketing performance metrics. You need to be able to do those things when you want to and you shouldn’t be forced into views you don’t need. Data deluge happens when everybody is reporting lots of different metrics across many different platforms. Once you’re drowing in data, you’re spending too much time swimming through it and not actually using the information to inform decisions.
Another issue with everybody using different platforms are the additional costs. Besides the obvious cost of each tool, there is the associated cost of onboarding personnel to use the tools, get them integrated, and have people trained, etc.. Each tool exports data differently, which means someone has to spend time dealing with all of these different formats. Then, if the person who knows how to use that tool leaves, the cost cycle begins again.
One Analytics Platform – Custom Views

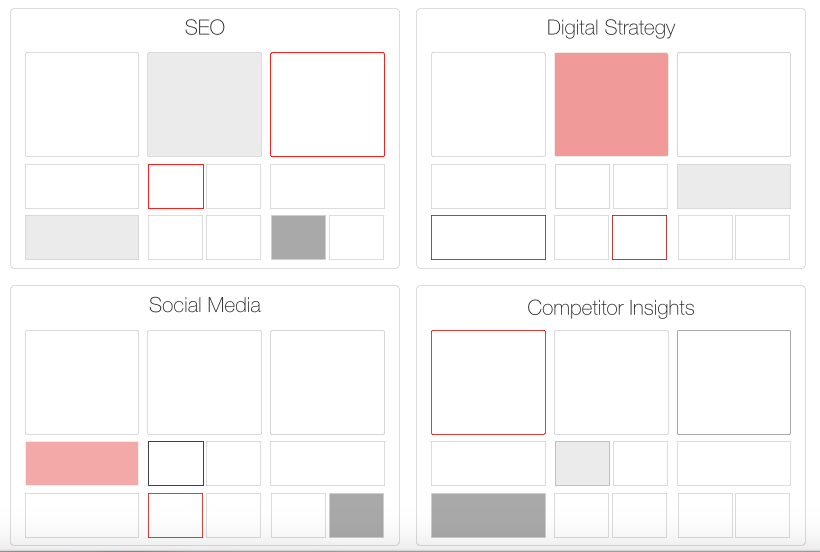
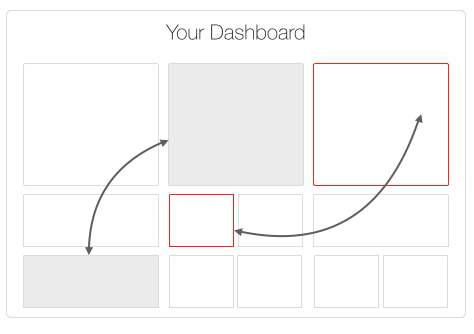
Customized dashboards are a flexible solution to the problem of having too many tools, or having too much data to wade through to get to the data you want. A custom dashboard solution ensures that everybody is creating reports using the same data set. A customized view allows access for various teams to get the data they need without forcing them to sift through what they don’t need. It gives you the ability to parse out different marketing functions and look at them discretely, or as part of the entire marketing ecosystem.
Reporting is easier and more accurate using custom dashboards. You can create reports on functions for the entire marketing operation and get a true top down picture of how things are performing. You can also see the interdependencies of marketing elements, campaigns, and channels and make decisions about what people are doing and how each function is affecting the entire organization’s findability and traction.
Some benefits of custom dashboards include:
- Shared data source means you’re all comparing apples to apples across your organization
- Create custom views for specific roles such as content, social media, SEO, executive, etc.
- Share a single platform for analytics and automated reporting, saving time spent aggregating and reviewing
- Share tasks, workflow, reporting, and overviews to ensure you’ve got a seamless team environment
- Dive into the specific data that pertains to your role at a detailed level so you can get the insights you need
- Create custom reports for each team / role and at the entire marketing organization level in one place
- Get recommendations to better your content and search efforts, increasing findability for your brand
GinzaMetrics just released Custom Dashboards for marketers as part of all our platform plans. Learn more about the custom dashboards feature here, or view our slideshare on the problem with using multiple dashboards.
