

So a marketer walks into a pitch…
And blows it.
As marketers, many, many of us have been there: you visualize a full-scale campaign or new marketing initiative, and it simply doesn’t land with your clients or higher-ups. At Found Conference, Tracy McDonald from Seer Interactive talked about building a better pitch by speaking directly to what matters most: return on investment. Whether you’re pitching to a client or another department, bottom-lining can create buy-in: but you need real, usable data to do so.
Whether the pitch is for $1,000 to update the content on your homepage, or $13,000,000 to buy a competitor’s company, you need to speak in terms of return. Let’s look at how Tracy builds her own ROI calculator, using her own data.
Step 1: State your assumptions
You also need to be able to show your math as you pitch new content. So, state the assumptions you’re making. And, know that not all assumptions are bad — you just need to acknowledge the world in which you’re working. You don’t have to know everything — but you do need to admit to what you don’t know.
Here are some of Tracy’s assumptions:
- There’s no such thing as zero monthly search volume. Google has confirmed that 15 percent of their yearly searches are new and have never been searched before. If you build a great presence for a search term that you think makes sense, don’t panic when Google tells you that nobody has ever searched for that phrase. When calculating return on a piece of content that may rank for two or three years, what is the true likelihood that nobody will ever search for that phrase?
- Click-through-rates are different for each position in the SERP. We know that it’s likely that the top result gets a higher CTR than the tenth. So, Tracy recommends building a custom click-through rate based on your data from Google Search Console, segmented by brand and non-brand queries. For both brand and non-brand, create three calculators, for good (ranking in the top 8), Better (ranking in the top five) and Best (ranking in the top two) search ranking.
- The zero-click landscape is real! Zero-click searches — searches that don’t lead to a click onto your site, but may show information on the SERP — are experiencing an astronomical rise. count the SERP features appearing for your target. Or, simply Google your term and notice how many listings and how many “other” organic objects appear. The more search features that appear for your search, the more listings appear — and the likelihood of a click-through is (we assume!) higher.
Taking each of those assumptions into account, Tracy builds an actual SEO ROI calculator in Google Sheets. She uses her assumptions to build an actual revenue return. Here, she drops an unbranded click-through rate curve, along with the click-through percentage for SERP features, to see the actual likelihood of a click-through.
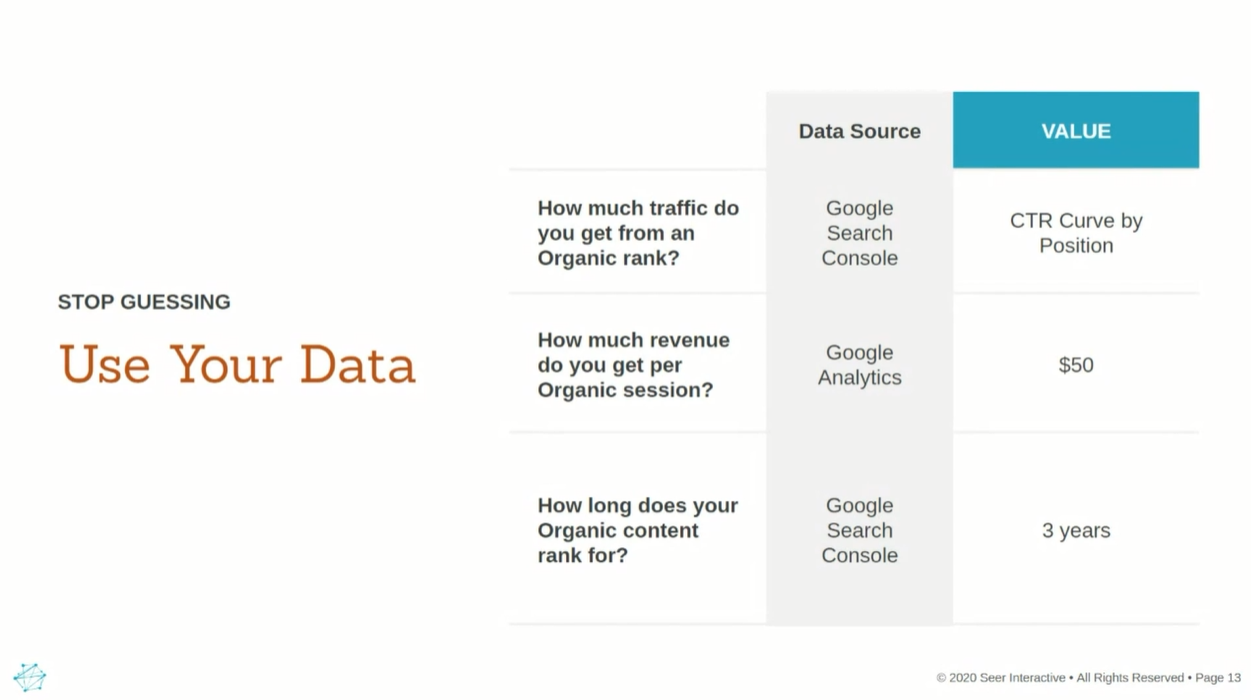
Step 2: Use your own data to stop guessing.
Building an ROI calculator for a piece of content can seem daunting — but, you likely have everything (or nearly everything) that you need. So, what data do you have access to?
- Click-through rate: How much traffic do you get from an organic rank? We should know how many clicks we get per impression, thanks to Google Search Console. So, build out that click through curve by position. Again, create three calculators, for good (ranking in the top 8), Better (ranking in the top five) and Best (ranking in the top two) search ranking.
- SERP organic percentage: How much of the first SERP page is filled with organic results, versus zero-click content?
- Per-session revenue: How much revenue do you get per organic session? That one’s easy — if you use ecommerce tracking or conversion goals established in Google Analytics, you can simply pull from GA to find that number.
- Ranking duration: Finally, how long does your organic content rank? If you’re going to build a piece of content and it’s going to last only a month, that’s a very different ROI than something that ranks for three or five years. Don’t use industry knowledge here — use your own data from Google Search Console.
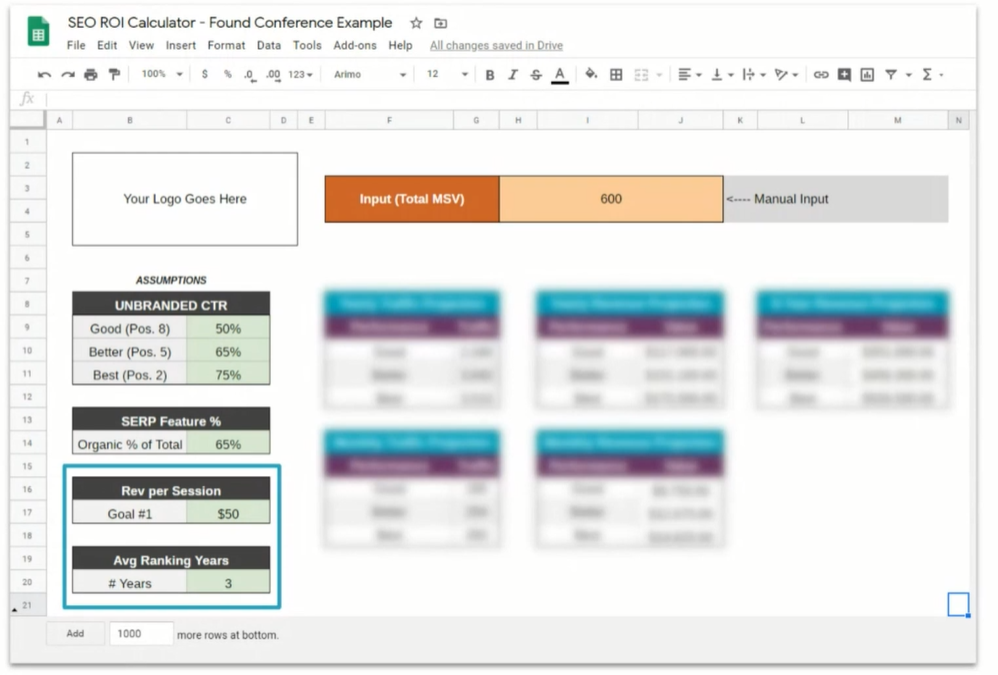
Step 3: Build your calculator
Once you’ve gathered your data, you can build out your actual calculator. You’ve determined how much revenue per session you can reasonably achieve, and how many sessions you can reasonably achieve — the rest is just math.
Tracy recommends setting up a Google Sheets page, creating a box for each of those assumptions on the left side (check out the example below). Next, load those assumptions — click-through rate, SERP organic percentage, per-session revenue, and ranking duration — into your Sheets calculator. Set aside the monthly search volume as its own field: you want to demonstrate ROI as a variable of MSV.
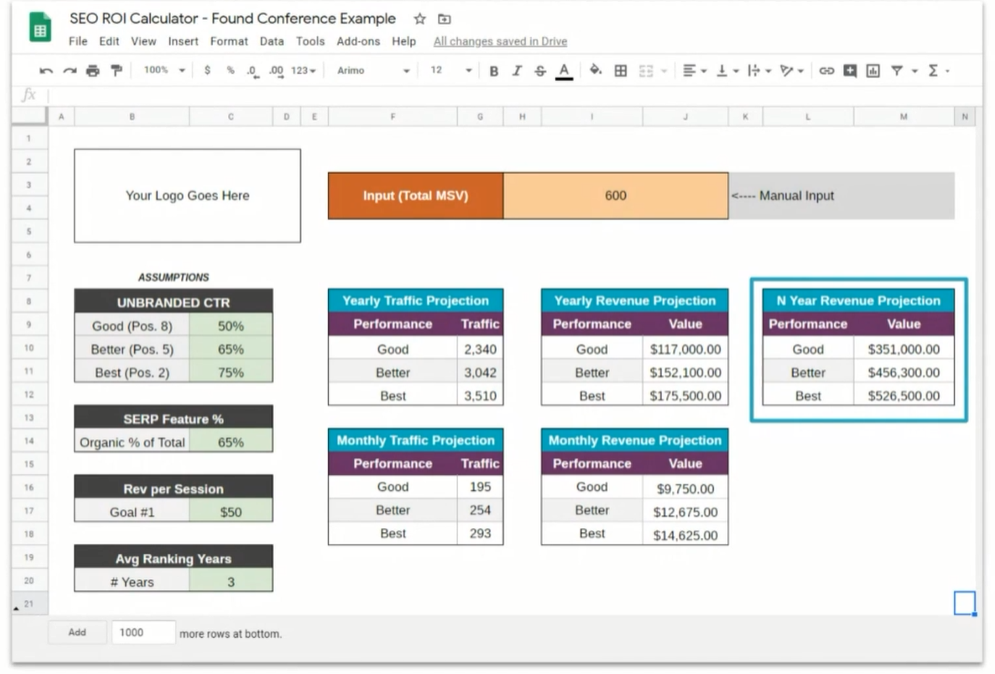
Next, set up your results. Estimate your monthly traffic by multiplying your click-through curve by your SERP feature percentage and total monthly search volume. Then, multiply by twelve to get your yearly traffic projection. Use your revenue per session to extrapolate your monthly and yearly revenue projections. Then, multiply your yearly projection by the average ranking years — the number of years you expect this content to rank — to find your n year revenue projection. That’s the total revenue you expect to make on this content throughout its lifetime.
Step 4: Land your pitch — by thinking outside the organic box.
So, you’ve got the numbers: you’re using real, well-sourced data to back up your estimated ROI for the content you’re pitching. This data is showing your audience that organic isn’t just for “ranking” or “awareness” or “brand recognition” — it makes money! Make sure to round out your pitch by answering a few additional questions that you can guarantee your audience will want to ask.
- Think of the other side: what’s the cost of building this content? Who’s going to create the content: an in-house team, a contractor, you? How much will your client or higher-up need to pay that content creator? And, are there multiple elements in the design process (copywriting, photos, visuals)? If you can ballpark the cost of production, you can estimate the actual ROI — not just revenue.
- What is the potential return from other channels for this piece of content? If you build a piece of content can you load it on paid media and paid social? Say this content never ranks: can you still use that content in PPC? If there’s a clear use for that content outside of onsite organic, be sure to mention it.
- What if the numbers change? During your pitch, you’ll likely get tons of “what ifs.” This is the beauty of building your calculator in Google Sheets — and of taking your calculator to your presentation. If your data is off, or your client anticipates a change in per-session revenue, plug in those numbers as needed.
Sharing these points show that you’ve considered revenue and return, you’re ready for external factors that may alter the outcome of your data, and you’re thinking of uses for content beyond organic. By using an ROI calculator, you’re taking the rather abstract idea of organic content and putting it in terms the C-Suite understands — revenue. You didn’t just not blow it — you blew them away.