If you’re still trying to show ROI for your marketing efforts by tracking all your keywords, topics, and content separately, you’re probably among the 79% of marketers who feel showing return on marketing initiatives is a challenge.
For lots of marketers and SEO teams, getting actionable data may still mean viewing all your data lumped into predefined groups set up by analytics companies who don’t know your business model, or sorting through thousands of keywords and hundreds of pieces of content separately. No wonder so many are having trouble getting the data they need.
 Getting an organizational structure in place to view the data you need, categorized in a way that mirrors how your marketing and SEO efforts are already organized will help you track your KPIs and inform your marketing decisions. Keyword groups and content groups are a quick and efficient way to better understand your marketing and SEO performance.
Content and Keyword Groups

Tracking every piece of content and each keyword separately is simply too cumbersome for most marketers and SEO departments. The large lists of keywords, topics, content, and lists of webpages that accumulate after even a short time of content and SEO efforts are too hard to manage individually. Thinking in terms of groups and categorization can help to manage and streamline the process. Content and keyword groups are a way to segment and view the topics, keywords, and content you’re tracking.
Keyword groups are simply the full list of keywords associated with your brand segmented and grouped according to marketing campaigns and:
- Geographies
- User personas
- Product features
- Product lines
- Campaign messages
Once you’ve created the keyword groups that best fit your marketing efforts, group all your keywords into those specific segments. One keyword may fit into multiple groups and can be tracked as part of different campaigns or various groups within a campaign.
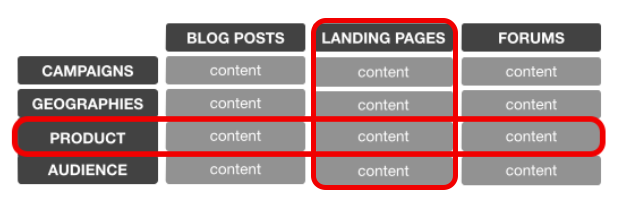
“Let’s say you wanted to track both marketing campaigns and product lines, you could add a keyword to both the marketing campaigns and product line groups and then you have the abilty to slice and dice the data to see how one influences the other,” advises Erin O’Brien, COO.
A similar process is used to create content groups. All of the content that you’ve created can be added to various groups. While a group of content may be specific to a particular product or feature, a specific blog post, landing page, social post, or email may be part of a marketing campaign. The idea is to be able to view traffic to your site from a variety of perspectives.

“You can become very effective at managing keywords and topics in terms of groups when you start assigning some additional meaning to them,” advises Ray Grieselhuber, Founder & CEO. “You can start grouping keywords in terms of how they relate to your campaigns and how they reflect the purchase intent of your customers.”
Get Data That Informs Marketing Strategy
Once you import your keywords from an analytics system, you may be left with hundreds or thousands of keywords that refer to thousands of pages of content, even hundreds of thousands of pages of content, depending on the type of site you’re managing. Being able to segment data and provide reports that reflect your actual marketing efforts will give you layers of insight into everything from what’s creating conversions to how people are moving through a product life cycle. It’s imporant to be able to view data in a variety of ways to cross-compare the effectiveness of different factors.
“Marketing is an ecosystem that relies on a lot of different variables, such as the interdepenencies of creating content and in sharing that content across multiple distribution methods,” notes Erin. “People sometimes don’t understand that one type of distribution, one piece or content, or one email that gets a lot of traction could be influenced by something else they’re doing. The email that just got a lot of opens and click throughs may have been successful because the previous email led to people wanting to take action a second time.”
Getting data organized in a way that allows you to see the interdependencies of assets and channels and aggregate that data across different views and cross sections will give you a better idea of what is influencing successes. Content and keyword groupings provide a way to view data that is more specific than an overall picture of all keywords, content, and marketing efforts, and more informative than individual page and individual content-level statistics.
Setting Up Keyword and Content Groups
Athough there can be some barriers to setting up keyword and content groups, particularly if your analytics platform doesn’t have an easy way to create and manage these groups. Still, there are some best practices that can save you some time and get you started organizing your data without a huge amount of effort. Take these first steps:
- Decide how you want to segment your data by what you want to achieve – map out what you want to be able to measure by:
- Products
- Features
- User personas
- Geographies
- Types of services
- Marketing campaigns
- Purchase intent phases
- Test out your segments by adding a few keywords and a few pieces of content. Once you start to populate the group, you may decide you want to segement the group slightly differently.
- Create parallel keyword and content groups to see the correlations between keywords and content.
- Determine a time period after which you will go back and check in to make sure your groupings are working the way you want them to.
- Check to see if all your core content is included in your groups.
- Add in new content as it is created.
“A lot of this is about developing good habits. If you set up and start out the right way early on, it’s really easy to keep up. It’s like good SEO practices. If you just create pages with SEO best practices in mind, it’s easier than going back and fixing it later,” recommends Erin. “If you always just add content to content groups and keywords to keyword groups when you add them into the system, it prevents that cumbersome task of going in and having to add everything at once.”
Creating a Purchase Intent Model
Another way of looking at this is from the customer journey-centric keyword group matching or mapping perspective of tracking how your customer will find your products and potentially buy them. When customers reach your site, they’ve already gone through a number of different phases and have used specific language associated with purchase intent. You can use these terms to create your content and keyword groups.
“Basically, purchase intent is when you evaluate your customer’s navigation, their search patterns, and the way they search to find things on your website,” advises Ray. “You’re looking at the keywords they use and the types of things they’re looking for and that ties back directly to where they are in the funnel.”
The stages of the customer journey can be identified by the types of searches they engage in:
- Early in the purchase phase – research queries. This phase is characterized by looking on search engines trying the find the best product in a general product category. Searchers use generic keywords and will be looking for advice.
- Comparison shopping – comparison keywords. This phase is characterized by asking for product versus product content or by words that relate to “how to” solve a specific problem.
- Price Comparison – best price queries. Once they’ve decided what they’re going to do, prospects are going to start making price comparison queries. These queries include “I’m ready to buy”.
“While most companies want to be there at the conversion point, what they don’t realize is that if you haven’t been there the entire time, you’re going to be facing an uphill battle in terms of actually getting audiences to use your site. Being there in the early phase is where content marketing can really help,” notes Ray.
Successful Measurement and Reporting
The biggest barrier to measuring marketing and SEO success and creating reports that answer the questions most executives have about return on investment, sales, and retention rates is that most analytics platforms make the process of creating keyword groups and customized reports cumbersome and complicated. Most people end up viewing and reporting on a lot of data that isn’t really actionable.
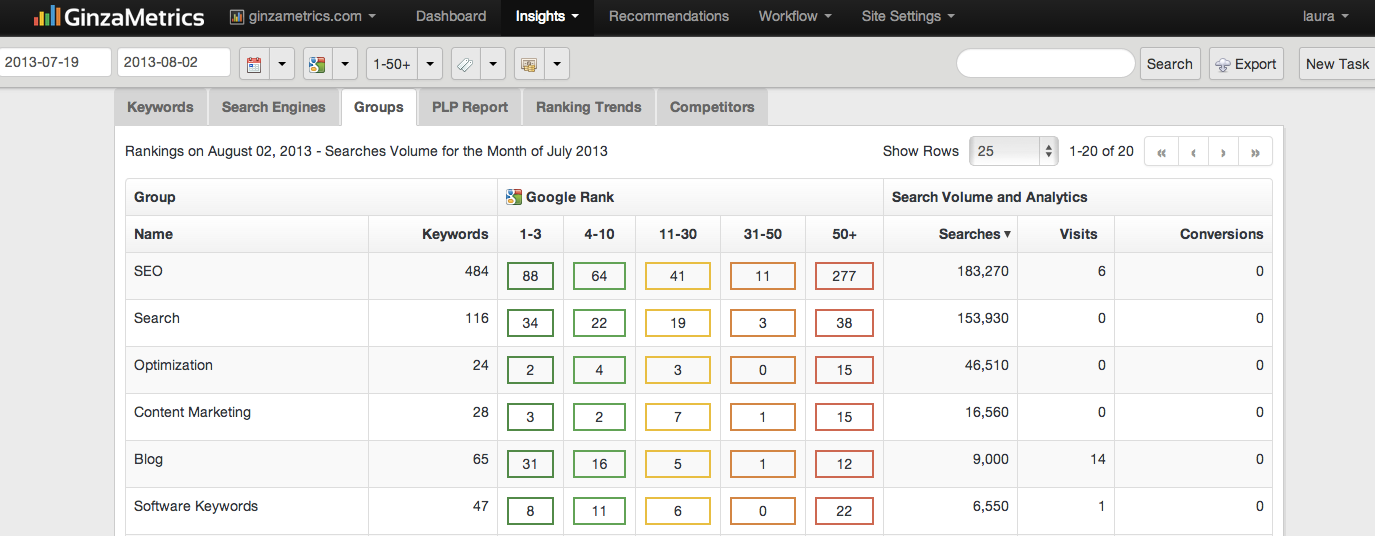
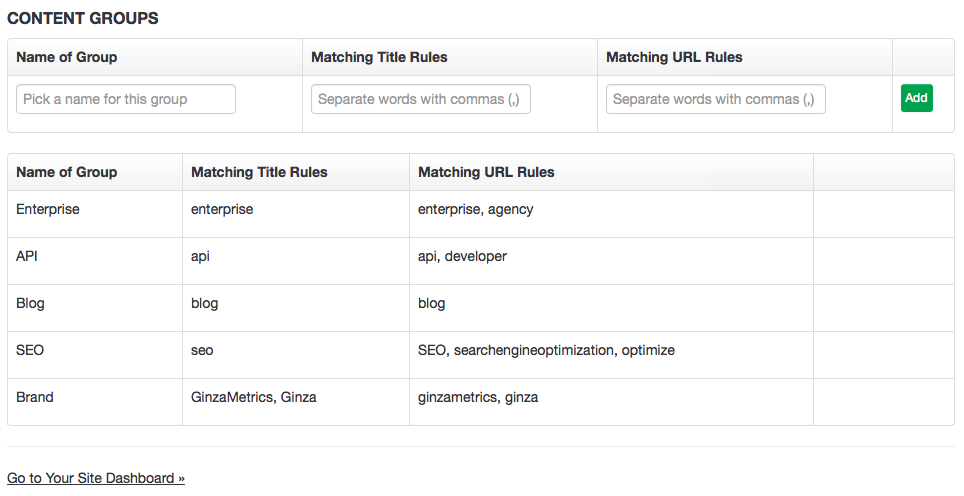
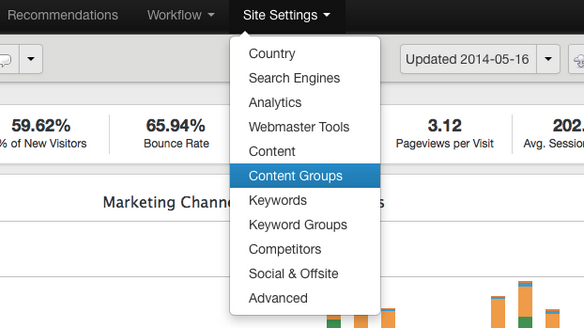
“If you didn’t set up your keyword and content groups up front, lots of analytics platforms require that you add each of these manually,” notes Erin. “It takes a ton of time and people don’t want to do it. That’s why we provide an automated keyword and content grouping feature with GinzaMetrics that allows you to intelligently create groups on the fly so that it doesn’t feel so insurmountable.”
If you’re not looking at your marketing efforts in groups and still wading through data on every individual keyword and piece of content, consider starting with one group. Don’t try to get all your data organized all at once and don’t worry about getting everything perfect the first time. Start on a small scale and create just one group.
“My advice is to try to create groups in terms of what’s going to make sense for you to manage things day-to-day and to help you report back to the executive team during those monthly meeting,” states Ray.
Build a process that begins by thinking in terms of keyword and content groups and that thinking will carry over to marketing strategy and reporting.
“When we talk about better reporting, remember that the media, the message, and the method are all part of an ecosystem,” states Erin. “When you start looking at what’s working and what’s not, you’ll want to be able to tell if it’s the channel, or if it’s how you’re sending it out – blog, video, infographic, or if it’s specifically what you’re saying that isn’t working. You can’t make those kinds of decisions if you’re not grouping things in a way to measure them as part of the ecosystem.”
Getting your data organized in a way that can inform your marketing efforts and improve your reports to your executive team takes a little effort up front. Think of it as a really messy room, or that closet you keep procrastinating cleaning. It’s easier to keep it organized once it’s been organized, than it is to sort out the mess that has accumulated. At least, if you have to get in there and clean up the mess, you’ll feel better when you’re done.

If you need an analytics platform that gives you the flexibility to group your data based on your business model and create custom reports, give us a shout and we’ll set up a personalized demo.

