The DemandSphere engineering team has been hard at work building new features this summer, with a particular focus on giving SEOs and Agencies a big-picture view of their organic search performance.
We’re pleased to announce the following new features:
- Unified Visibility, a holistic view of your search performance
- Additional enhancements to our Google Search Console (GSC)-based True Keywords feature, with trends for all major metrics
- Our new Top 20 Share of Voice insights puts critical SERP data in an easy to use and share across large teams and site portfolios
- New metrics added to Data Explorer
What should you know about summer 2023 feature updates?
Unified Visibility
This is a feature we are particularly excited about. Our visual ranking and pixel depth metrics have been one of our most popular features and the reason for it is due to the changing shape of the SERP. Simply tracking rankings is not enough anymore, you need to understand the way the SERP is changing over time because this affects your potential traffic and Click Through Rate (CTR).
In order to enhance our visual ranking and pixel depth data, we’ve create a combined set of insights called Unified Visibility.
Unified Visibility takes advantage of our integration with GSC to deliver our True Keywords feature - surfacing ALL of the keywords that are driving traffic.
But, as we all know, you don’t really want to rely on GSC metrics alone. They can be…a little off sometimes. Which is why we decided that we had to have a comprehensive view of the following in one chart:
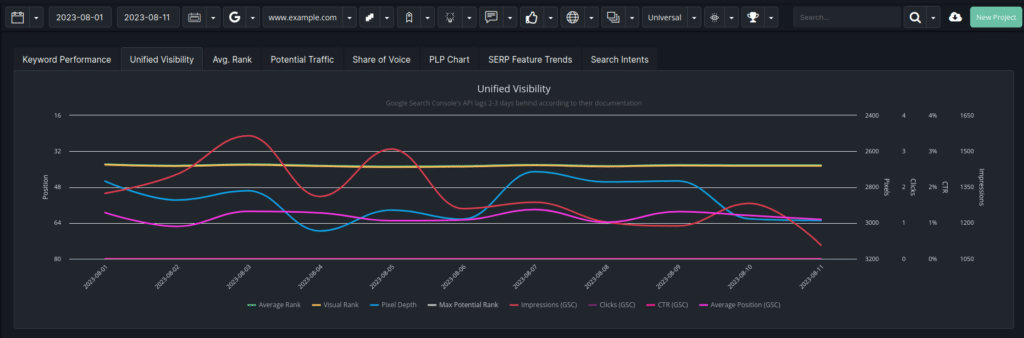
- Average organic ranking
- Visual Ranking (where do you rank relative to all of the SERP features on the page)
- Average pixel depth of your visual ranking
- Average position (GSC)
- Impressions (GSC)
- Clicks (GSC)
- CTR (GSC)
The value of being able to correlate all of these metrics, especially pixel depth and CTR, is already getting a lot of great feedback from our customers.
Google Search Console Trended Views
As a follow-on release to our GSC-based True Keywords feature, we’ve added more trended view on the data.
The True Keywords feature is very important to customers with large site and keyword portfolios because it allows them to maintain their own copy of their GSC data, going all the way back as far as the API allows, without having to do a bunch of extra configuration in BigQuery. And for those customers who need BigQuery syncing with this feature, we provide that service as well.
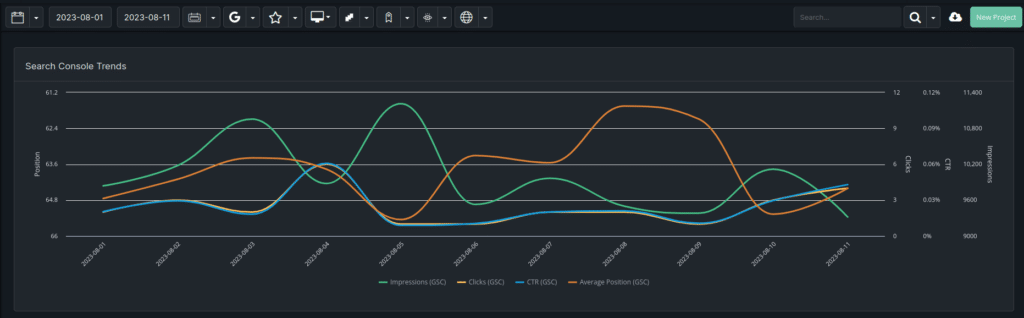
This looks similar to the chart above, but where the chart above is for tracked keywords, this covers all of the keywords available in GSC, including any tracked keywords you might have. This allows you to select new keywords for tracking right in the context of the GSC data you already use for reporting – with a single click.
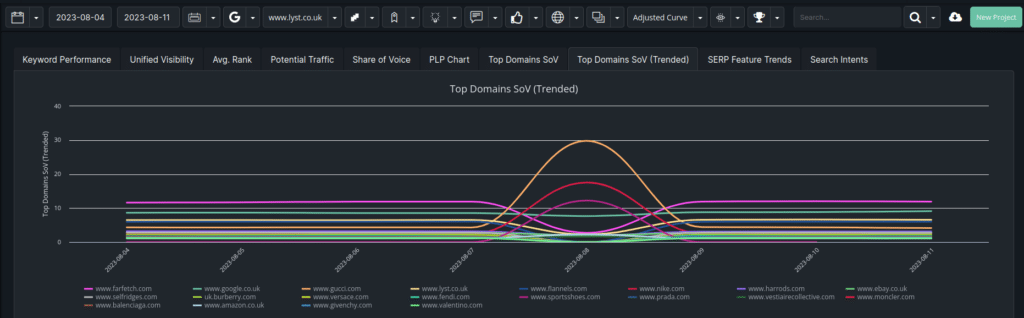
Top 20 Reporting and visual Share of Voice
Recently we’ve had a number of customer migrate to our platform from other vendors and one feature that we kept getting requests for was the Top 20 report.
We’ve long had a similar set of reports in our Competitor Discovery tools but we saw an opportunity to further enhance these capabilities.
What this feature does is it captures all the data in the top 20 positions of the SERPs, including all of the SERP features, and then builds a visual Share of Voice metric based on the visibility a searcher would have when looking at a search results page.
This matters a lot because if your visual share of voice is too low, you’re basically not going to get any clicks for that keyword. More importantly, if your competitors have a higher visual share of voice than you do, you’re missing an opportunity.
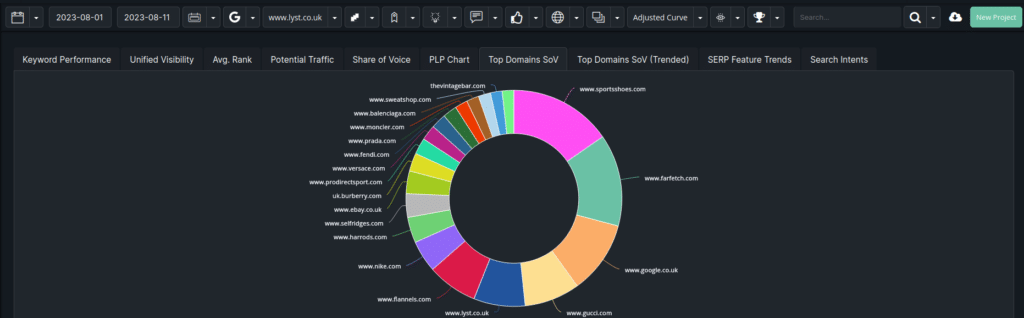
The feedback that we’ve gotten on this feature so far has been great. It was a popular feature in another well-known tool but customers have told us that our UI / UX are a big improvement, which we are always happy to hear.
This feature is currently available for enterprise features that request it and we are rolling it out as requests come in.
New Metrics added to Data Explorer
Data Explorer is one of our reporting widgets used in the UI and custom dashboards that allows customers to build customized and compared views of how their metrics trend over time. It’s quickly becoming one of our most popular features and we’re adding more to it all the time.
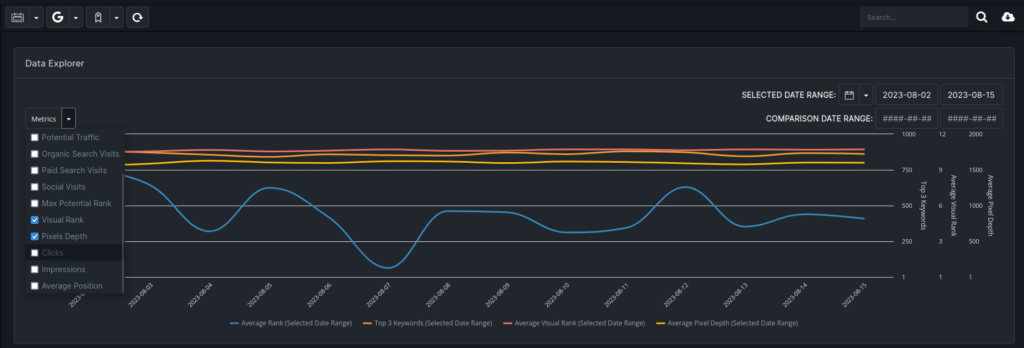
As part of this release, we’ve added the following metrics into data explorer:
- Visual rank
- Average pixel depth
- Average position (GSC)
- Impressions (GSC)
- Clicks (GSC)
- CTR (GSC)
Custom Dashboard and API Availability
As always, when we release new charts and reporting widgets, we make them available in our custom dashboards so you can configure them for your internal or client reporting. We have the ability to make any of these metrics on an accelerated basis available via our APIs or sync with BigQuery and other data warehouses.