In the continuing saga of Google’s battle against the automated indexing of SERPs, contrary to the needs of those businesses that those SERPs are built from, we are announcing additional countermeasures within DemandSphere to better identify, flag, and remove poisoned SERPs.
What is a poisoned SERP?
A poisoned SERP is a complete, normal-looking Google results page whose usual results have been swapped out. There is no error and no CAPTCHA. Nothing on the page says anything is wrong, it is designed to be misleading. A SERP analytics platform stores it as real data and reports it as a ranking change.
These poisoned results can come from many different places, of different levels of authority. We are tracing some interesting patterns and we will write further about this but it’s important, in our view, to not get too focused on the specific patterns as Google can change them at any time.
As an example, say you are tracking “herbal fruit tea” in the UK on desktop. The same seven sites have held those results for months. One morning the page we collect has two of them on it, and the rest are sites that have never ranked for the term. The layout is normal, the result count is normal, nothing is missing. Your report shows the brand falling out of the top ten. Nothing happened on Google. This is a poisoned SERP.
Why it matters
A poisoned page can make a ranking jump or disappear for a day even though nothing changed on Google. It is important to catch these reliably, both in order to maintain data quality and also to keep a clean baseline for future anomaly detection.
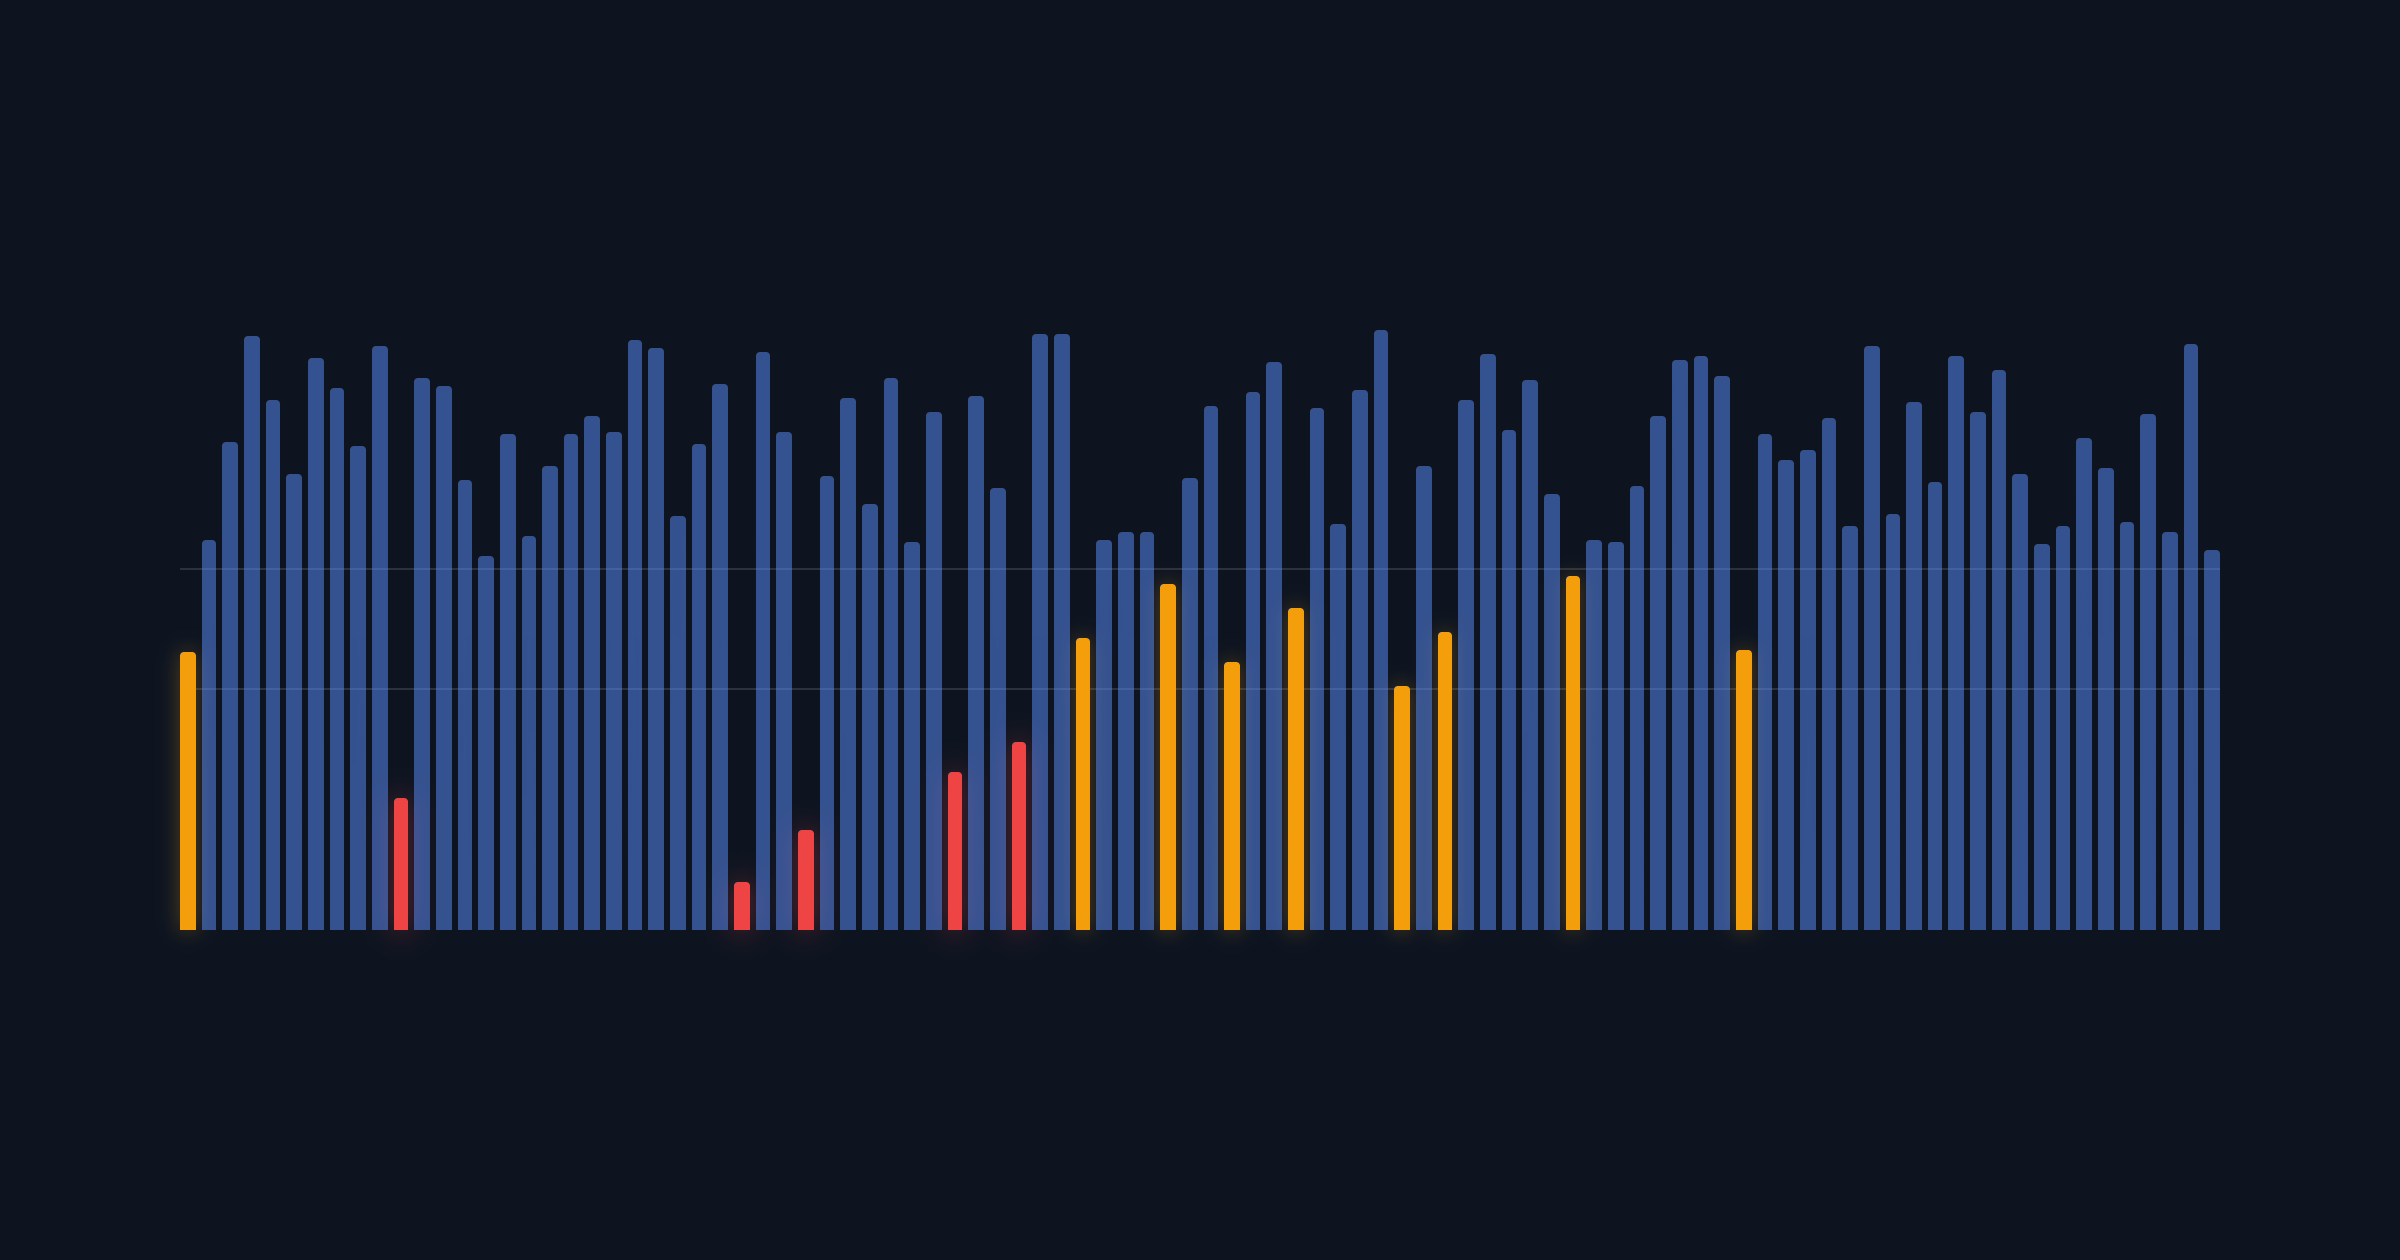
We are tracking the daily rate at which these occur. For October 23rd, 6.7% of the SERPs we collected were poisoned.
came back poisoned
This is the same class of problem we wrote about in Spurious data in Google SERPs, where Google returns deliberately degraded results to traffic it suspects is automated.
How it works
In order to detect poisoned SERPs, we compare each new page with that keyword’s own recent history. If the page is missing the sites that usually rank for the keyword, it is suspicious.
First we keep a baseline: the last 30 collected pages for a daily keyword, or the last 10 for a weekly one. From that baseline we find the keyword’s regularly appearing domains, meaning the sites that show up on at least 60% of those pages. Herbal fruit tea has seven. A brand term might have two.
Then we score each new page on the share of those domains it contains. Six of seven scores 86%. One of seven scores 14%. Where that score lands decides what happens to the page.
Collected again, up to three attempts.
Used and marked. Kept out of the baseline.
Used, and added to the baseline.
The check is per keyword, against that keyword’s own history rather than any global list of sites. For a keyword with seven regular domains, five or more is clean, three or four is flagged, and two or fewer is poisoned.
What happens to a poisoned page
We collect it again, up to three attempts in total. If any attempt comes back clean or flagged, we use that one and stop. If all three come back poisoned, we keep the best of the three, meaning the one with the most regulars, and mark it as poisoned.
Either way you’ll get a ranking for the day. The label we provide adds a layer of observability so you know how to treat that data point.
How do we know it is poisoning and not an algorithm update?
Honestly, a single low score doesn’t tell us that. It does tell us the page does not look like what this keyword normally returns. A real algorithm update produces exactly the same signal, and so does a Google test, and so does ordinary volatility on a keyword that was never stable to begin with.
We then ask three additional questions in order to make the final determination:
Does it re-appear?
This is the strongest signal and the key reason to re-fetch. Rankings that genuinely changed do not change back ninety seconds later. If the second attempt returns the regular domains, the index did not move and we were handed a bad page. If all three attempts come back the same way, that is evidence the change may be real, which is exactly why we keep the best of them and mark it instead of throwing the day away.
Does it persist?
An update holds. Look at the days either side. One poisoned day between two clean ones is almost never an update. This is similar to the drop-and-pop analysis we wrote about in the Observability post.
Does it travel?
Updates move correlated sets of keywords, usually concentrated in a vertical, and they are usually confirmed. Poisoning turns up on scattered individual fetches across unrelated queries at the same time. A rate like 6.7% spread evenly across every vertical we collect is not the shape an algorithm update makes.
Two cross-checks help as well, and the first one is already live in our platform.
We join Google Search Console data at the keyword level, so both average positions and impressions for the affected keyword sit next to the ranking we collected, with nothing to export and nothing to line up by hand.
That matters here because Search Console is Google reporting on real user sessions, gathered entirely outside our collection path.
That doesn’t mean it’s an entirely trustworthy source on its own. This is Google we’re talking about and anyone in SEO worth their salt is aware of the problems with GSC data. But the name of the game in our industry is triangulation with data. If impressions held steady on a day our collection showed the brand gone, the page we were served was not the page users saw.
The second is our Google Algorithm & AI Search Update Tracker, which records confirmed updates and rollouts and makes it quick to rule an update in or out.
We are not claiming certainty on any individual page. The marker is a statement about how much to trust that data point, not a verdict on what Google intended.
Keeping the baseline clean
Keeping the baseline is a top priority, so we never include flagged or poisoned results in the baseline going forward.
The baseline defines what normal means for a keyword. If poisoned results were to get mixed in, what counts as normal would shift over time, making it impossible to have any objective baseline for comparing results.
What you will see in the app
| Marker | What it means | How to read the rankings |
|---|---|---|
| None | Clean. The page matches the usual results | Use as normal |
| Flagged | The page had 40 to 59% of the usual sites | Probably fine, but double-check any sudden move that day |
| Poisoned | All three attempts were under 40%, and we show the best one | Treat with caution and compare with the days around it |
A flagged or poisoned day is usually a one-off. If the days around it are clean, rely on those.
Daily percentages across the three outcomes will sit in the Observability dashboards, alongside the rest of the second-order data we keep about collection. Those dashboards are still being built and we will announce them when they are live. If you have not come across Observability yet, this post explains what it is for.
Next steps
As we have stated before, we’re in a whole new world with Google SERPs. The way to deal with this is through a multi-pronged strategy of triangulation of data sources, rapid and iterative improvements to the platform, as well as transparency at every step along the way.
Let us know if you have any questions or comments and we’ll address them in future posts.