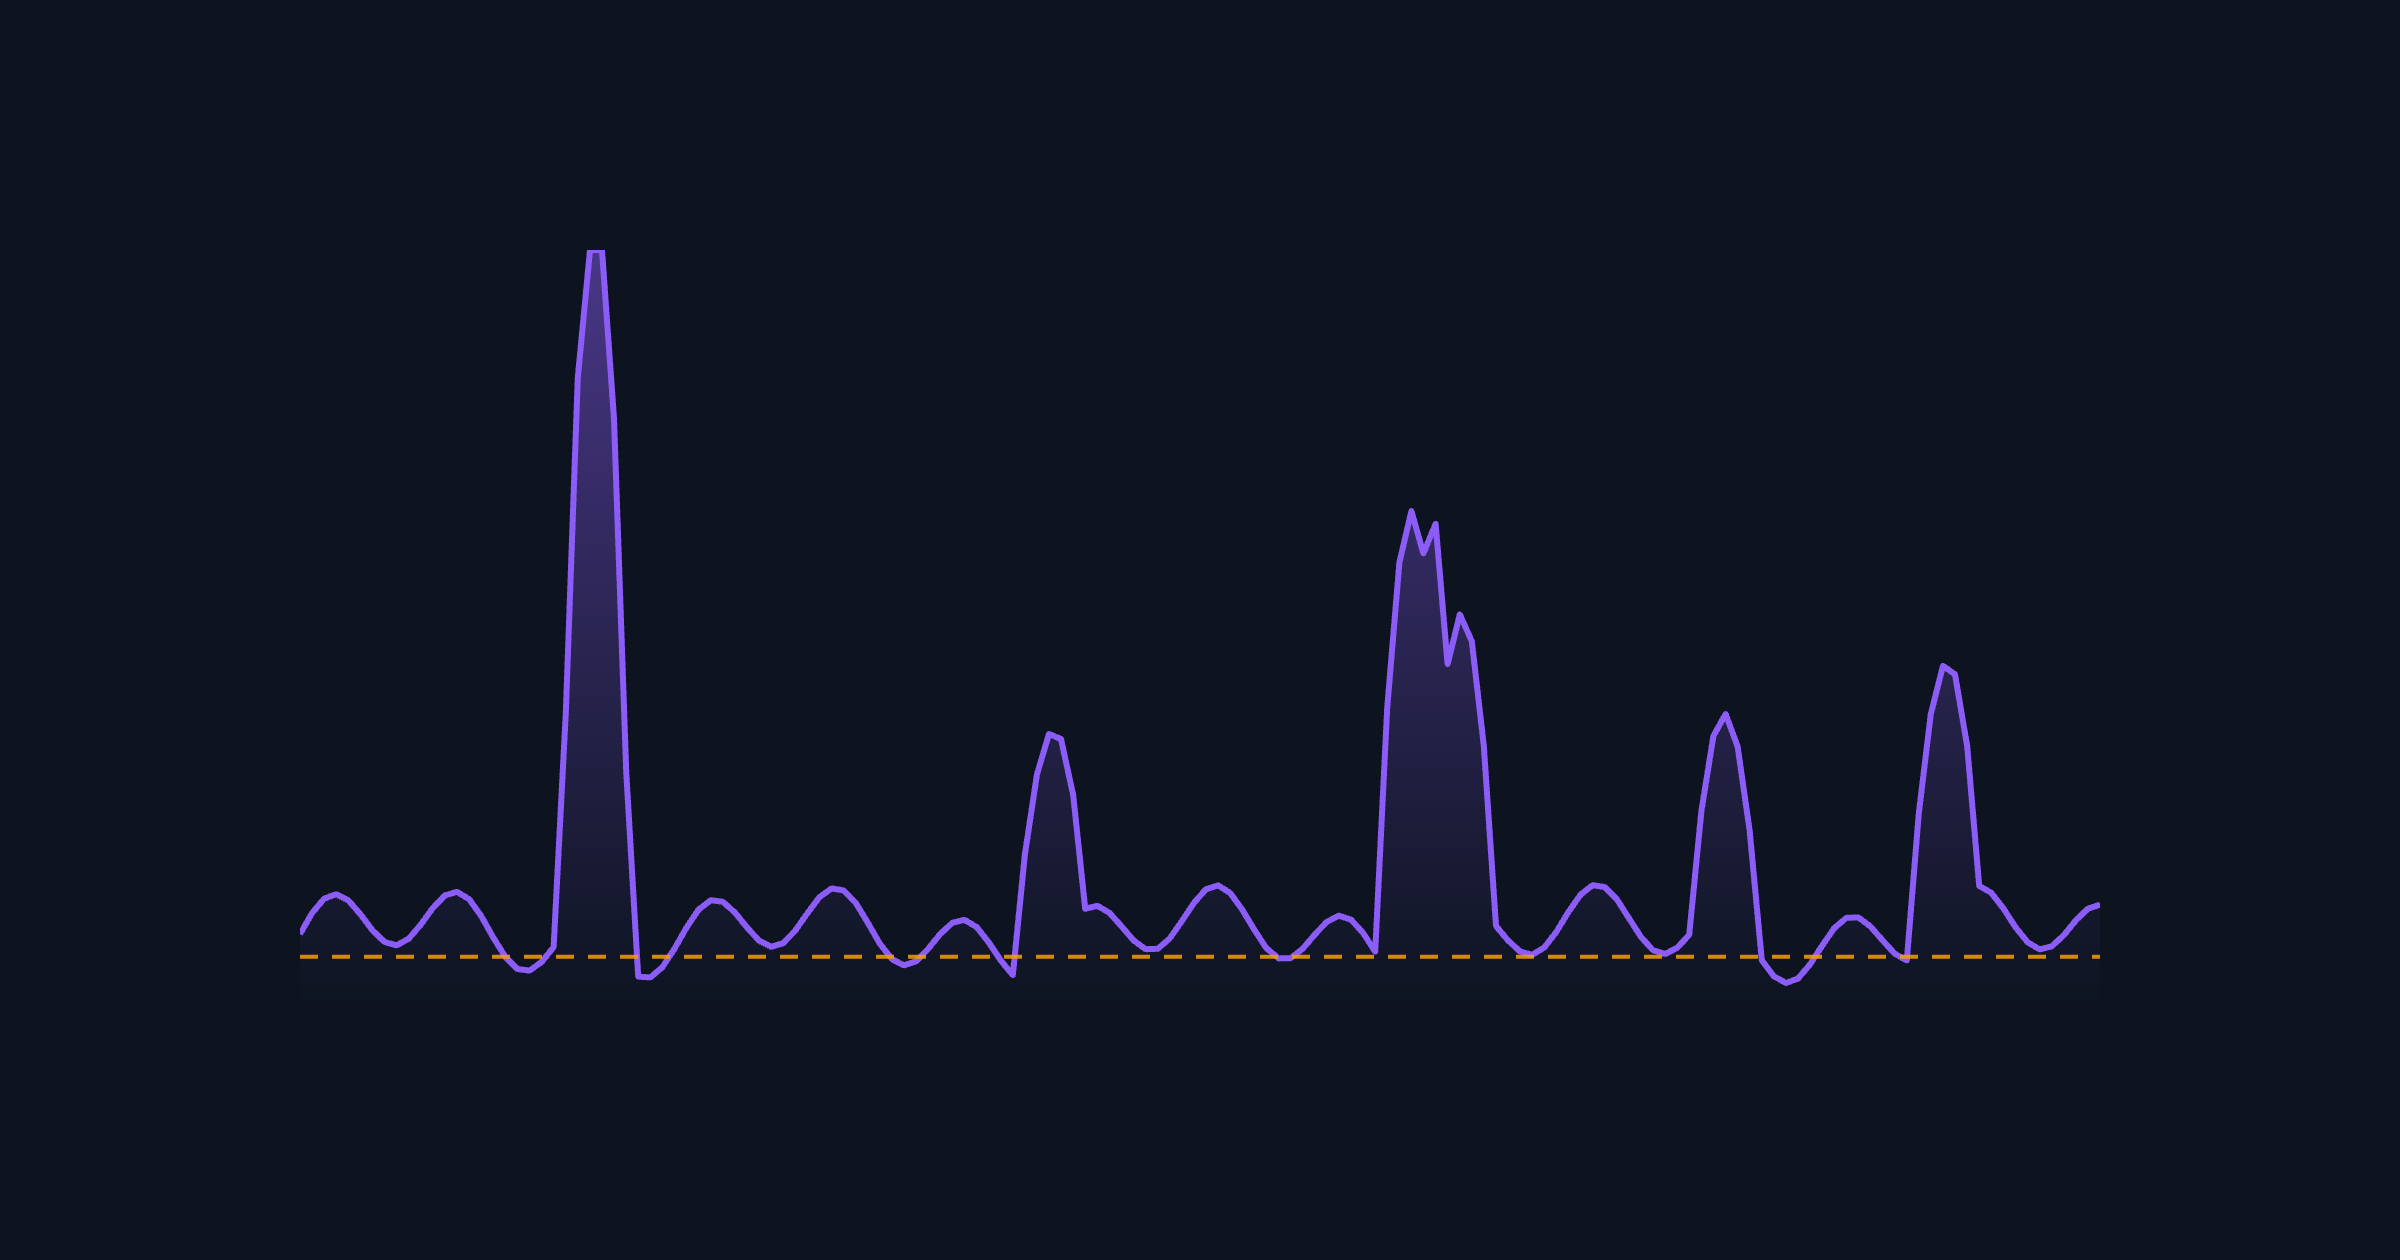
Observability is a word from IT Land. We don’t usually hear about it much in the world of SEO and AI search, although we should and I think we’re going to hear about it a lot more.
As we’ve been discussing recently, the landscape of search data is changing in many ways, but one key change is that it is becoming an increasingly volatile data set to work with.
This volatility is, in our view, directly correlated with the value it provides AI and data teams. It’s a scarce resource, it’s hard to get at scale, and it provides a look at the forces that reflect, influence, and shape consumer behavior on a scale that cannot be found elsewhere.
It is also our data, like yours and mine. This goes back to our belief that if there is data about you or something that affects you, then it is your data. Same thing goes for your websites.
The key players who claim to “own” this data thrive on information asymmetry and, as a result, aren’t particularly inclined to make it easy to get.
Hence the volatility.
As this volatility has increased, especially over the last year, it has become increasingly important to build data about this data to answer questions like: what is the error rate, sampling rate, number of pages being fetched, and so forth, on a daily basis.
And the shape of these questions and answers differs depending on the engine in question. If we’re talking about Google SERPs, then it has one set of characteristics, and data from ChatGPT has another. And so on.
To date, as far as we are aware, there isn’t much out there from vendors such as DemandSphere (or anyone in our market) providing answers to these questions as a part of their offering.
We feel that it is time to change that and, as a result, we are announcing a new feature within our platform called Observability. We’ve been working on this for a few months. It’s not what we would consider “done” as it will be evolving every time there is a new big change and there is still a lot more that we want to do with it.
First, let’s establish a formal definition of what Observability is in the IT world.
What is Observability in IT and data?
The goal of Observability is to understand a system’s internal state and the key characteristics that shape how data within the system manifests itself. All data has a shape. Observability describes that shape and the forces that act upon it. Traditionally, there are a number of key aspects to Observability, including:
- Logs: the raw data, typically row-level data of events that will be aggregated
- Metrics: key observations about the events themselves
- Traces: essentially, the signals needed to trace the metrics shown back to the logs collected
Observability vs. Monitoring
They may sound similar, but Observability and Monitoring are two different things. Traditionally Monitoring focuses on predefined alerts and looking for certain patterns. Observability is designed to provide more ad hoc levels of flexibility to analyze the data.
In the context of SEO and AI search and, specifically for our feature, we are adding an additional facet to this definition: first-order vs. second-order.
First-order is the data that everybody pays for: SERP data, LLM data, etc.
Second-order is the data about this data. Again, this will be data points like error rate, sampling rate, etc.
In a perfect world, there wouldn’t be a need for much second-order data about the first-order data but, as of October 2026, we’re in a new world.
We can confidently predict that we are entering a new era of volatility and that it will be key for customers to understand what is happening within their data systems on a regular basis.
This does add a large new burden on platform vendors that did not exist before and it is something that will take time to build up. But we’ve decided to do it and we’re announcing this new feature set today.
Observability in DemandSphere
There have been a number of volatile changes with data, particularly from Google, over the last year. We log the confirmed ones on the Google Algorithm and AI Search Update Tracker.
One that we haven’t had a chance to talk about too much publicly yet, and it hasn’t affected everybody, is what we call “drop-and-pops” (“DnPs” for short).
A drop-and-pop occurs when Google temporarily tanks a given domain’s rankings for a few days and then brings them back to where they were. This is something that has occurred, to varying degrees, for years. But clients started to notice an increase in these in May. We needed a way to show the extent, impact, and volatility levels of these events. We also needed to be able to show when some percentage of results happened to recover.
We set a 7-day window for this, on a rolling basis, and have developed our first version of Observability around this phenomenon.
Here are some views from REI (not yet a client but we’d love to talk to you), a domain we use a lot for demos.
An overview of the DnP situation:
Trended view:
Volume-weighted trends:
Position trends by tier, which show whether damage is concentrated or spread evenly:
An additional view on confirmed lost keywords (DnP did not “pop” again within 7 days):
We have a similar one for recovered keywords.
We are, this week, adding some additional metrics, one of which we will discuss in our next blog post about Google serving spurious results.
These metrics will cover both the spurious results rate and also the overall sampling percentage, along with details around which keywords have sampled data on a day-to-day basis.
Conclusion
Given the world we’re heading into, we believe strongly that transparency and Observability are critical aspects of any data strategy and that is doubly true when it comes to the world of search. Let me know any questions or feedback!