Today, I’m excited to announce the availability of new features in your GinzaMetrics dashboard. These features come as a result of the continued evolution of search and content, and will help our users to optimize findability by their target audiences. They went live in beta the morning of October 8.
The latest updates from Google continue to point toward the importance of high quality content and the need for integrated analytics as secure search rolls out.
To provide our users with the most accurate, useful data possible, GinzaMetrics is releasing the first in a series of product updates. This update includes a new Content Insights page, which delivers the only hybrid solution to addressing Secure Search, as well as the option for device filtering, enabling users to drill down into specific traffic data from desktop, mobile and tablets.
New Content Insights Page Delivers Data To Address Keyword: “(Not Provided)” Changes
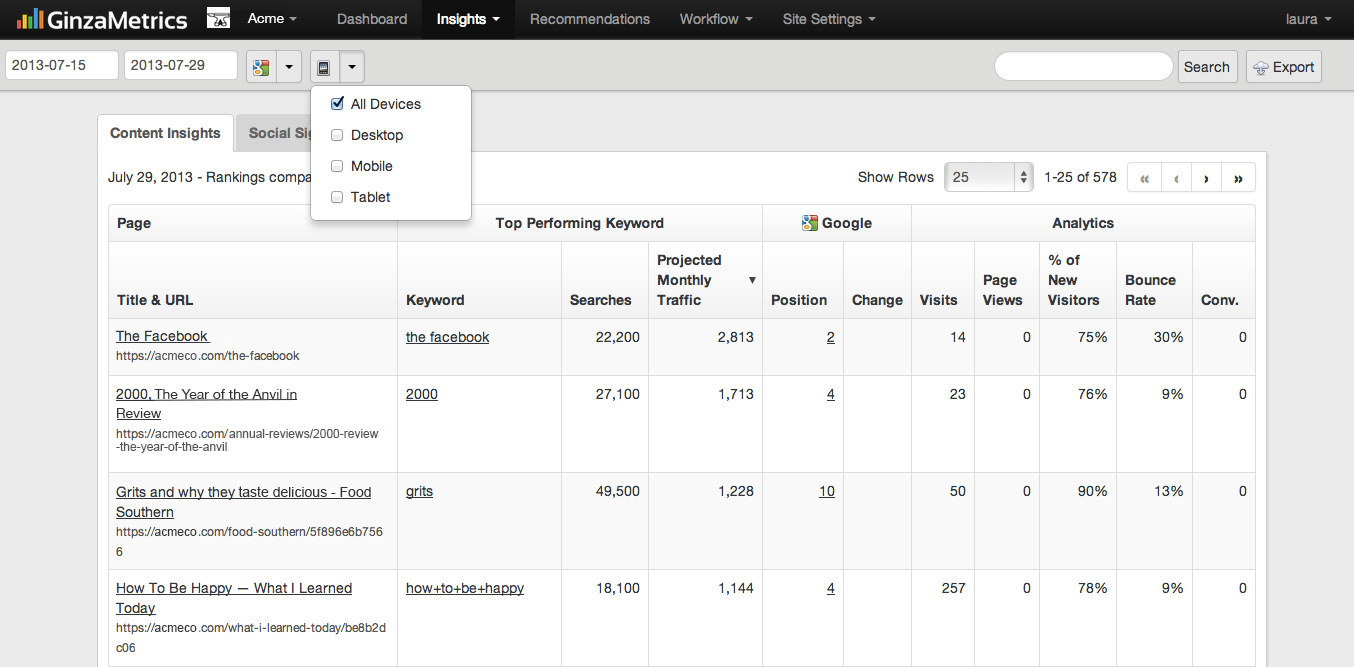
The new Content Insights page provides page-level analytics pulled from users’ third-party analytics solutions (Google Analytics, SiteCatalyst, etc.).
With these updates, analytics data is taken for each page and correlated to the most relevant (traffic driving) keywords for that particular page based on your keyword target settings and GinzaMetrics’ own algorithms. This allows us to display page analytics data, utilize page traffic to infer how much traffic a specific keyword is driving, and project monthly traffic based on search volume and CTR curve.
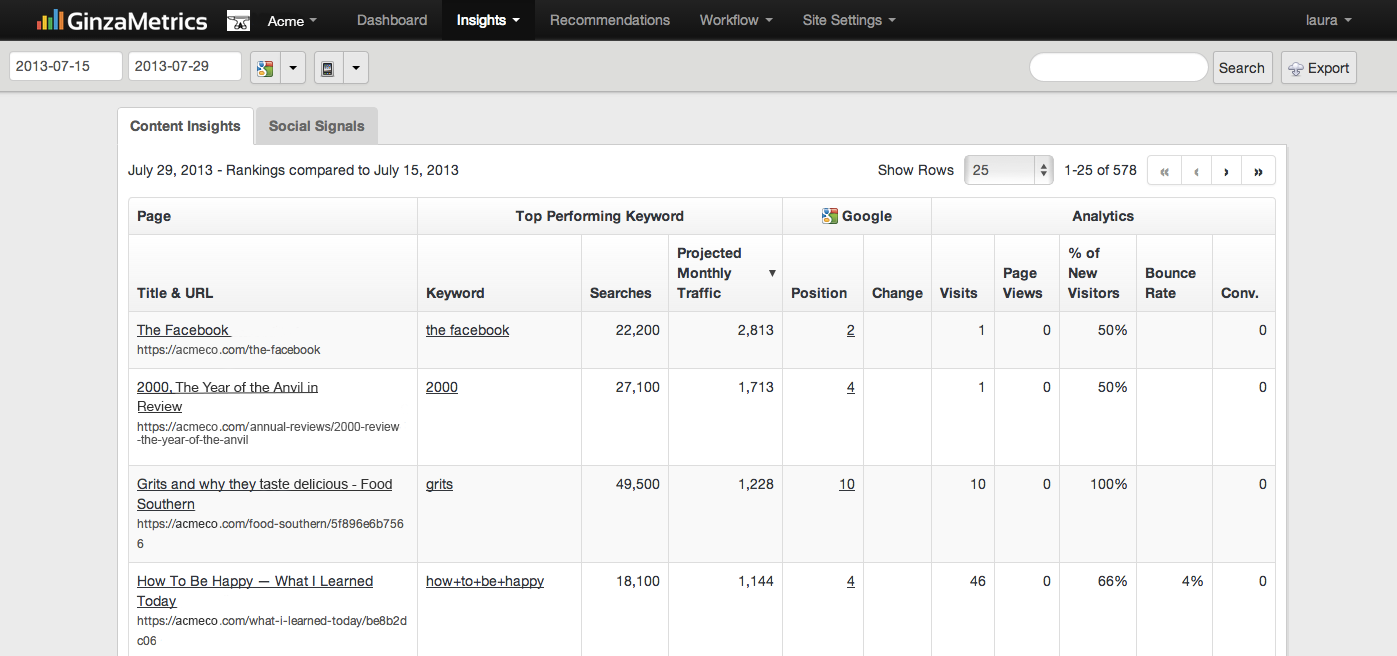
Your new Content Insights dashboard includes the following data for your site content and keywords:
-
Searches – This column reflects the total monthly searches for your targeted keyword on Google.
-
Projected monthly traffic – Your projected monthly traffic is based on an algorithm that combines data from total monthly searches for your keyword, current position and other factors.
-
Position – This reflects your current position within Google’s SERP (search engine results page).
-
Change – View your change in position over time in this column, with positive changes reflected in green and negative changes in red.
-
Visits – See total visits to your page over the time period selected. (To adjust the date range simply visit the filters in the top left corner of your dashboard and choose a data range.)
-
Pageviews – Here you can see total pageviews for your site content.
-
% New Visitors – See what percentage of your pageviews are the result of new visitors. This will help you understand how much new traffic you are driving as a result of campaigns and content optimizations.
-
Bounce Rate – See your page’s current bounce rate and understand how it changes over time with improvements from our recommendations.
-
Conversions – View total conversion for your site content. (You must set this up in your analytics system in order to display in your dashboard.)
Custom Data & Reporting Views
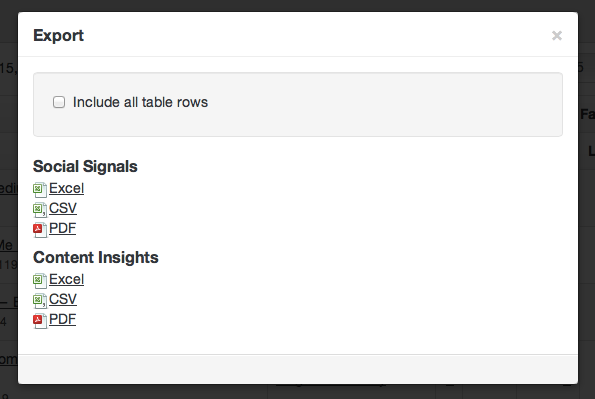
To give you maximum data flexibility, you can sort and view your data by columns, simply clicking on the column header allows you to change the view by ascending and descending views. These settings will be applied to reports you generate from within the page.Use the Export option at the top right corner of the page to create reports in Excel, csv and PDF formats quickly.
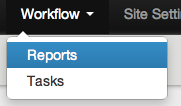
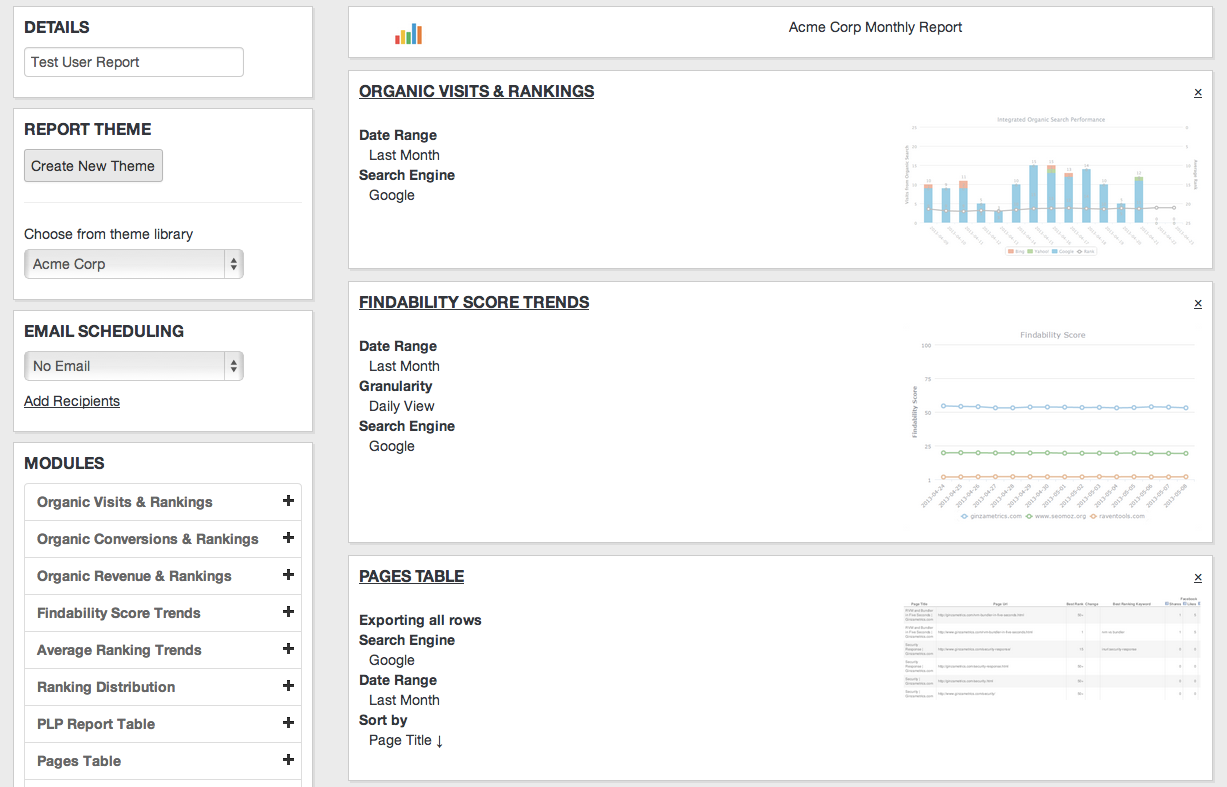
Use the Workflow option in your main navigation to create reports based on your Content Insights page. Reports can can be scheduled based on daily, weekly or monthly needs, and can also be sent to recipients of your choosing (including members inside or external to your organization.) The easy module design means you can customize date ranges, data types and other things to match your needs. Use the theme options to white label reports to maintain brand consistency.
Social Signal Integration
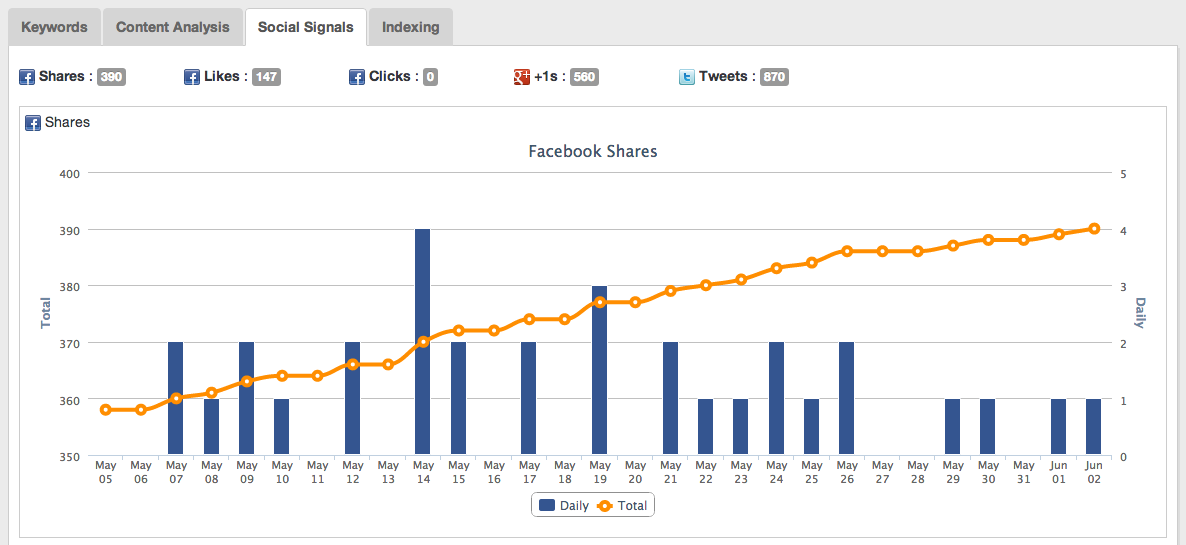
Based on your current pages and targeted keywords, understand how your content is performing on social channels.
Social signal data includes Facebook Shares, Likes and Clicks; Google +1s; and Twitter Tweets. Use social sharing data to dive deeper into how your content is found by target audiences.
Mobile Traffic Filters
As mobile traffic continues to rise and generate visits for both earned and paid media, GinzaMetrics has integrated a device filter to better understand this data. Users can now filter traffic by desktop, mobile and tablet devices and understand changes to visits, pageviews, percent new visitors, and bounce rate data. These updates are currently available in the Content Insights section of the dashboard and future releases will continue the integration of mobile and device data throughout the entire platform.
Persistent Date Filters
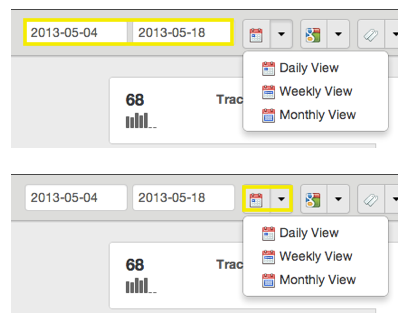
Now, when you select a date range in your GinzaMetrics dashboard, it will carry throughout your entire set of graphs and analytics charts. This feature is designed to reduce the amount of time it takes to view and navigate throughout custom data selections within the tool.
Learn more about Google’s recent updates by reading or watching “The State of Search & Content.”
Press Release: Search and Content Platform GinzaMetrics Announces First Hybrid Solution for Marketing and SEO Professionals to Handle Google Secure Search

